
Introduction
A principal does not need more data. A principal needs the right exceptions, trends and comparisons at the right time.
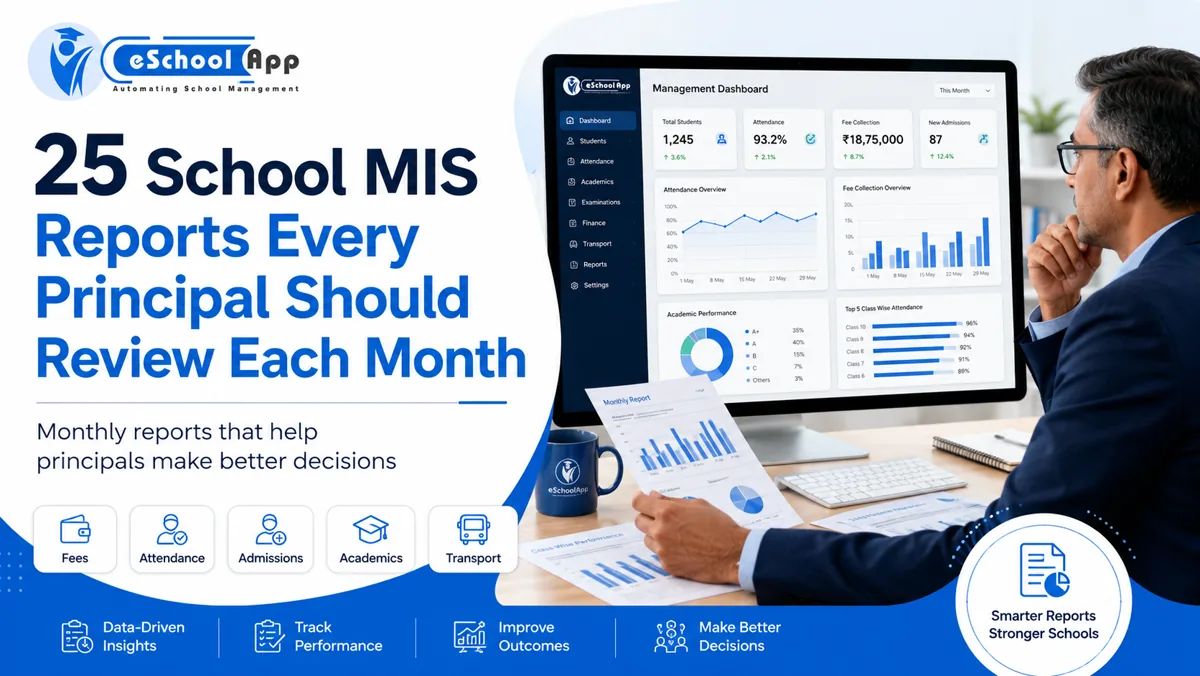
School ERP dashboards often become crowded because every available number is displayed. The better approach is to define a monthly management pack: a small set of reports leadership reviews consistently.
The exact reports will vary by school, but the 25 below create a strong starting point across admissions, attendance, fees, academics, staff, transport and inventory.
They are not intended to replace statutory or board-specific reports. They are management reports – designed to answer “What changed, where is attention needed, and who should act?”
On this page
- Admissions: 1-5
- Attendance: 6-10
- Fees and Payments: 11-15
- Academics: 16-19
- Staff: 20-22
- Transport and Inventory: 23-25
- Do Not Turn the Principal Dashboard Into 25 Tiles
- Use Red/Amber/Green Carefully
- Create a Monthly Management Review Rhythm
- How eSchoolApp Reporting Can Be Evaluated
- Frequently Asked Questions
- Final Thoughts
Admissions: 1-5
1. Enquiries by Source
Shows where prospective families came from: website, referral, campaign, walk-in, portal or event. Use it to judge marketing quality, not just lead volume.
2. Enquiry-to-Application Conversion
What percentage of genuine enquiries started an application? Break it down by class, campus or source where useful.
3. Application-to-Admission Conversion
Shows how many completed applications resulted in enrolment. Large changes may indicate capacity, eligibility, follow-up or pricing issues.
4. Pending Admission Actions
A list of applications waiting for documents, approval, payment, interaction or another defined step. This is an action report rather than a summary.
5. Class/Grade Intake vs Capacity
Shows admitted students against available seats by class or grade. This helps management identify both high-demand and under-filled levels early.
Attendance: 6-10
6. Overall Student Attendance Trend
Compare the current month with previous months rather than looking only at today’s percentage.
7. Class/Section Attendance Exceptions
Highlight sections below the school’s defined attendance threshold.
8. Frequently Absent Students
Identify students with repeated absence or a sudden change. Use the report to trigger human review, not automatic labels or discipline.
9. Late Arrival / Early Departure Trend
Where the school records these events, trends can reveal transport, gate or scheduling issues.
10. Staff Attendance and Leave Summary
Management needs a consolidated view of absence, leave and coverage rather than a list of daily punches.
Fees and Payments: 11-15
11. Fee Billed vs Collected
Compare billed amount, collected amount and balance for the selected period.
12. Outstanding Fees by Age
Separate recent outstanding amounts from older balances. An ageing view is more actionable than one large pending total.
13. Collection by Payment Mode
Understand how much is paid online, bank transfer, cash or other approved modes. This is useful for reconciliation and payment-channel planning.
14. Failed / Pending Digital Payment Exceptions
A short operational list of transactions that need review. Do not make the accounts team search a full gateway report every day.
15. Receipt / Adjustment Exceptions
Highlight records that were reversed, refunded, adjusted or otherwise require verification. The categories should match the school’s fee policies.
Academics: 16-19
16. Examination Performance Summary
Show performance by class and examination period using the grading system the school actually follows.
17. Subject-Level Performance Trend
Which subjects improved or declined compared with the previous assessment?
18. Students Requiring Academic Review
Use school-defined criteria to surface students for teacher review. Avoid treating an automated report as a final judgment.
19. Result / Report Card Completion Status
Before result publication, show which classes have marks, remarks or approvals still pending.
Staff: 20-22
20. Staff Leave and Coverage Report
Show leave patterns and whether substitute/coverage arrangements create pressure in specific departments.
21. Payroll Exception Summary
Rather than displaying everyone’s salary, management may need a report of unresolved attendance, leave, deduction or approval exceptions before payroll is finalized.
22. Timetable / Workload Overview
A management view of teaching allocation can reveal unusually heavy or light schedules and unresolved timetable gaps.
Transport and Inventory: 23-25
23. Route / Vehicle Utilization
Compare assigned students, capacity and active routes. This can highlight underused or overloaded routes.
24. Transport Exceptions
Late route, GPS/device issue, unassigned student, vehicle change or other exceptions defined by the school.
25. Inventory / Low-Stock Exceptions
Management does not need every stock movement each month. It needs low stock, unusual issues/returns, pending purchase actions and high-value exceptions.
Do Not Turn the Principal Dashboard Into 25 Tiles
The title of this article says 25 reports, not 25 dashboard widgets.
A dashboard should show the small number of indicators that need frequent attention. Detailed reports can sit behind those indicators.
For example, the dashboard might display fee collection percentage and outstanding balance. Clicking it opens the ageing and transaction-exception reports.
The principle is progressive detail: summary first, explanation second, transaction detail third.
Use Red/Amber/Green Carefully
Colour can make management reports faster to read, but thresholds must be meaningful.
Do not make “red” mean “lower than last month” if a seasonal pattern makes that normal. Define thresholds based on policy, targets or known baselines.
For sensitive areas such as student academic performance or attendance, use flags as prompts for human review rather than definitive risk scores.
Create a Monthly Management Review Rhythm
A useful MIS process has three parts:
- Review: What changed?
- Explain: Why did it change?
- Act: Who owns the next step and by when?
If the same report is discussed every month but nobody records actions, the ERP is producing information without management value.
Keep a short action log alongside the reports.
How eSchoolApp Reporting Can Be Evaluated
eSchoolApp’s feature pages describe a management information system across enrolment, attendance, collections and staffing, supported by the same shared records used in operational modules.
During a demo, bring five reports your principal currently receives. Ask the vendor to reproduce the business question, not necessarily the existing spreadsheet layout.
If a current report takes two hours of manual consolidation, that is also a strong input to the school ERP ROI calculation.
Frequently Asked Questions
What is MIS in a school?
MIS stands for Management Information System. In a school context it provides management-level information and reports across academic and administrative operations.
Which report should a principal check daily?
Daily needs vary, but attendance exceptions, urgent fee/payment exceptions, transport issues and critical operational alerts are common. Monthly MIS should focus more on trends.
Should teachers see all MIS reports?
No. Access should match roles and responsibilities. Management reports may contain information not required for classroom work.
How many KPIs should be on the dashboard?
There is no universal number. Keep the dashboard focused and let users drill into detailed reports.
Can MIS replace management meetings?
No. MIS improves the evidence available to management; it does not replace discussion, context and decisions.
Final Thoughts
The best school MIS report is one that produces a decision or confirms that no action is needed.
Start with these 25 reports, remove the ones that do not matter to your school and add the few that reflect your own goals.
Then build a monthly review habit around trends and exceptions rather than printing large data dumps.
To connect reporting value to financial impact, link this article with the School ERP ROI guide.